

The impact of the Canadian border closure on Minnesota
August 10, 2021
Workers are getting pay raises and it could end up contributing to high inflation
August 11, 2021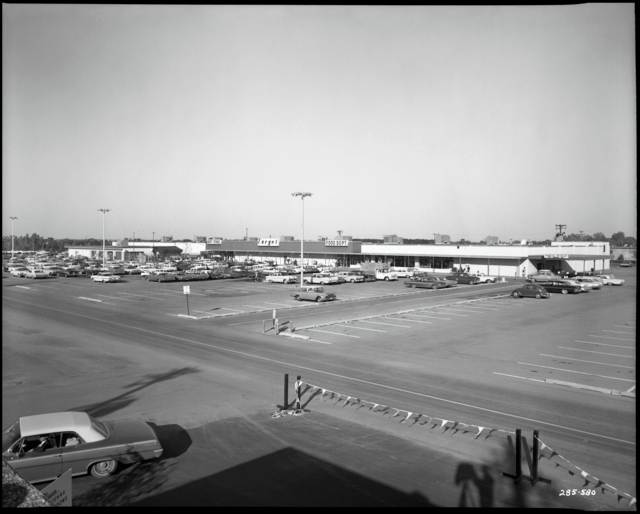
It was 1962 when the Dayton Company, of the Dayton’s department stores, opened the first Target store in Roseville, Minnesota.
The Target brand would ride a discount retail wave — the same one that spawned WalMart and KMart — that occurred in the middle of the 20th century, with a plan to focus on quality and customer experience as well as price point.
Today, Target is probably Minnesota’s best-known brand. It has nearly 2,000 in the U.S. and has become so ingrained in the country’s culture that it’s the setting of SNL skits and the butt of Target run jokes.
But even though Target’s corporate home is in Minnesota — as anyone who’s been enveloped in a sea of red-shirted, be-khakied workers making their way to Target Center (or is it Target Field?) in Downtown Minneapolis can attest — is Minnesota home to a disproportionate number of Targets? In other words, is Target kind of a Minnesota thing?
Enter the bullseye
Target was not particularly cooperative in MinnPost’s quest to find out; emails and a phone call seeking a list of open Target stores went unreturned. So we made our own list of the number of Target stores in every state from the company’s store directory.
Turns out, the U.S. state with the most Target stores is California, where the company lists 200 locations. That’s followed by Texas (153 stores), Florida (126) and Illinois (100). The states with the fewest Targets are Vermont (1), Wyoming (2) and Alaska (3). Minnesota falls near the middle, with 73 Target locations.
Those counts are perhaps unsurprising: Roughly speaking, the most populous states have the most Targets, and the less populous states have fewer. So what about when you account for population? Which state has the most Target stores per capita?

Actually, Minnesota — and by a lot. There are 1.28 Target stores per 100,000 residents in Minnesota. The runner-up is Kansas, with 0.88 stores per 100,000 residents. And California may have the most stores overall but it only has 0.51 Target stores per 100,000 residents.
Pretty safe to say, Vermont is the least Targety state. It not only has fewer stores than any other state, its per-capita rate is just 0.16 stores for every 100,000 people. At least they have the Vermont Country Store.
Targets per person is one thing, but a bigger factor in determining the ubiquity of Targets in a state could be how often you see them driving around — that is, their geographic density. For a rough measure of this, we calculated the density of targets by land area in all 50 states (counting only land, because as far as we know there are no floating Targets).
The state with the highest Target density? It’s New Jersey, where there’s one Target store for every 156 square miles. In Alaska, the least densely Targeted state, you might have to drive a lot farther to reach a Target: that state has only one store for every 190,213 square miles of land area.
And Minnesota? There’s one Target for every 1,091 square miles of the North Star state, putting it on the top 20, Target-density-wise.
.mp .credit {margin: 0; padding: 0;}
.current {font-weight: 700; background-color: #f4b4a6; padding: 5px 10px!important; border-radius: 15px;}
.mp .paginate_button {color: #C83D2D!important;}
.mp .dataTables_filter label {margin-right: 1em!important;}
.mp th.right {text-align: center;}
.mp td.right {text-align: right;}
.mp th.center {text-align: center;}
.mp td.center {text-align: center;}
#zoninator-zoneposts-widget-2 {display: none;}
targetsData = [[“Alabama”, “22”, “0.44”, “2302”], [“Alaska”, “3”, “0.41”, “190214”], [“Arizona”, “46”, “0.64”, “2469”], [“Arkansas”, “9”, “0.30”, “5782”], [“California”, “200”, “0.51”, “779”], [“Colorado”, “43”, “0.74”, “2410”], [“Connecticut”, “21”, “0.58”, “231”], [“Delaware”, “4”, “0.40”, “487”], [“Florida”, “126”, “0.59”, “426”], [“Georgia”, “51”, “0.48”, “1128”], [“Hawaii”, “7”, “0.48”, “918”], [“Idaho”, “6”, “0.33”, “13774”], [“Illinois”, “100”, “0.78”, “555”], [“Indiana”, “32”, “0.47”, “1120”], [“Iowa”, “21”, “0.66”, “2660”], [“Kansas”, “26”, “0.88”, “3145”], [“Kentucky”, “14”, “0.31”, “2820”], [“Louisiana”, “15”, “0.32”, “2880”], [“Maine”, “5”, “0.37”, “6169”], [“Maryland”, “40”, “0.65”, “243”], [“Massachusetts”, “49”, “0.70”, “159”], [“Michigan”, “53”, “0.53”, “1067”], [“Minnesota”, “73”, “1.28”, “1091”], [“Mississippi”, “6”, “0.20”, “7821”], [“Missouri”, “35”, “0.57”, “1964”], [“Montana”, “7”, “0.65”, “20792”], [“Nebraska”, “14”, “0.71”, “5487”], [“Nevada”, “18”, “0.58”, “6099”], [“New Hampshire”, “9”, “0.65”, “995”], [“New Jersey”, “47”, “0.51”, “156”], [“New Mexico”, “10”, “0.47”, “12130”], [“New York”, “92”, “0.46”, “512”], [“North Carolina”, “51”, “0.49”, “953”], [“North Dakota”, “4”, “0.51”, “17250”], [“Ohio”, “64”, “0.54”, “638”], [“Oklahoma”, “15”, “0.38”, “4573”], [“Oregon”, “21”, “0.50”, “4571”], [“Pennsylvania”, “75”, “0.58”, “597”], [“Rhode Island”, “4”, “0.36”, “258”], [“South Carolina”, “19”, “0.37”, “1582”], [“South Dakota”, “5”, “0.56”, “15162”], [“Tennessee”, “30”, “0.43”, “1374”], [“Texas”, “153”, “0.52”, “1707”], [“Utah”, “15”, “0.46”, “5478”], [“Vermont”, “1”, “0.16”, “9217”], [“Virginia”, “66”, “0.76”, “598”], [“Washington”, “40”, “0.52”, “1661”], [“West Virginia”, “6”, “0.33”, “4006”], [“Wisconsin”, “36”, “0.61”, “1504”], [“Wyoming”, “2”, “0.35”, “48547”]]
$(document).ready(function() {
var tableColumns = $.extend(true, {}, {
0: { sTitle: ‘State’},
1: { sTitle: ‘Number of Targets’,
bSearchable: false,
sClass: ‘center’
},
2: { sTitle: ‘Stores per 100k people’,
bSearchable: false,
sClass: ‘center’,
mRender: function(data, type, full) {
return MP.formatters.number(parseFloat(data),2)
}
},
3: { sTitle: ‘Square miles per store’,
bSearchable: false,
sClass: ‘center’,
mRender: function(data, type, full) {
return MP.formatters.number(parseInt(data),0)
}
}
});
var options = $.extend(true, {}, {
aaData: targetsData,
aoColumns: _.values(tableColumns),
order: [[0, “asc”]]
});
MP.datatables.makeTable($(‘.datatable-targets’), options);
});